There are some instances where a computer cannot be powered off for an investigation. For these circumstances a live incident response is performed. Another advantage to live investigations is that volatile and non-volatile data can both be analyzed providing more evidence than a typical offline analysis on a hard drive. The victim machine is the target of these investigations. These best practices are tool specific to Linux machines.
1. In performing a digital forensic live incident response investigation it is important to setup the environment correctly. Linux environments come with a variety of tools pre-installed that are useful in the investigation. However, for additional tools not already installed on the system, a disk or network drive needs to be created containing executables to the tools that will be used to uncover evidence. Recommended tools include:
- NetCat (http://nmap.org/ncat) – Create TCP channels between devices that can be used to pass information.
- Native Linux commands and tools (Explained in further detail throughout the guide)
- Netstat
- Lsof
- Ps
- Lsmod
- Crontab
- Df
- Top
- Ipconfig
- Uname
- Gdb
- Strings
Warning: The reason only executables are used in an investigation is because software installers will write into memory possible overwriting data. If incriminating data was deleted by a user, there is still a chance of uncovering it because it is not removed from disk. The only way to completely get rid of data is to overwrite it. There is a chance that software installers will overwrite such data and therefore are not to be used. This is why live investigations do not involve any type of information writes to the victim machine’s disk (Jones, Bejtlich and Rose).
2. Since data cannot be written to disk, it is best to map a network drive or use Netcat to transfer information between analyzing machine and the victim machine.
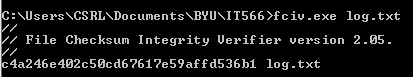
Warning: All files created or tools used need to include a checksum for validation against fraud. A checksum is basically the value of a file hash. If one character in the code or file is changed, the hash will produce a different checksum. This helps validate content. A specific application version will have a unique checksum different from all other versions of the software. A good tool to use to create checksums is File Checksum Integrity Verifier (http://support.microsoft.com/kb/841290).
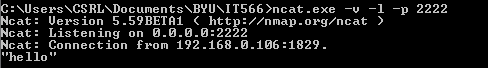
3. If using Netcat to transfer logs the following commands can be used:
Command to setup a Netcat listener on host machine: nc –v –l –p <PORT> > <LOG FILE>
The port number is any port desired for the Netcat listener to listen on for communication. The log file is just a file for the data to be stored in.
Command to send data from a victim machine: <COMMAND> | nc <IP ADDRESS OF LISTENING MACHINE> <PORT>
Basically the command sends the results of a command performed on the victim machine. <COMMAND> is the command issued on the victim machine. The IP address and port are of the host machine with Netcat listening.
4. The first step in the investigation is to retrieve the time and date on the victim machine along with some basic system details. It is helpful to have this information when an investigation is carried over multiple devices. Time and date should be compared to a trustworthy server. The date command can be used to retrieve this information.
Command: date
Warning: This is very important for time sensitive evidence to be presented in a case (Jones, Bejtlich and Rose).
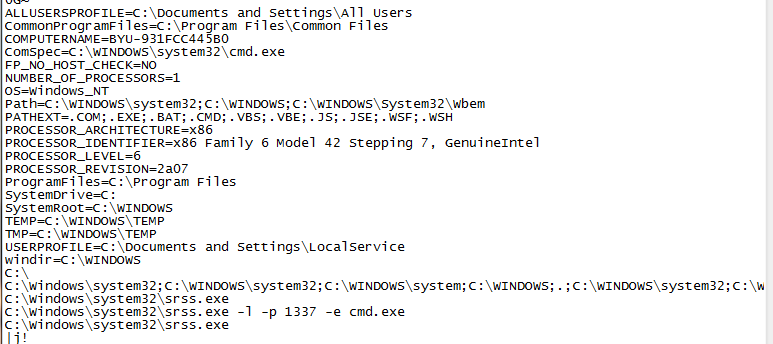
Command: ipconfig
Ipconfig retrieves network information such as the machine’s IP address and MAC address.
Command: uname –a
This command retrieves information such as a systems hostname and operating system version.
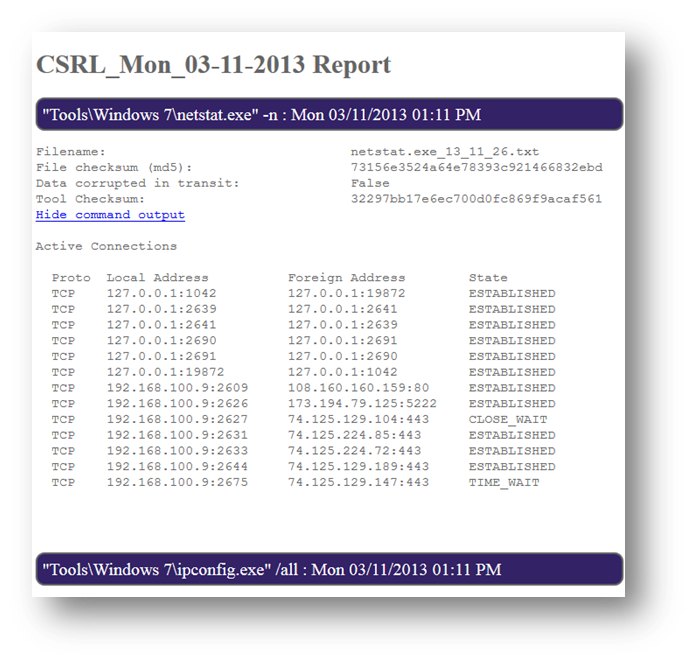
5. Current network connections are to be analyzed next to see if there are any unusual connections established to the computer or ports listening. Netstat is a native command that can be used to see these connections. This command also shows all open ports.
Command: Netstat –an
Warning: Look for established connections that are not authorized or that are communicating with unfamiliar IP addresses. Ports higher than 900, are not ports normally opened by the operating system and should be flagged as suspicious (Jones, Bejtlich and Rose).
6. Lsof is a native command to Linux that stands for “List Open Files.” It can be used to see the executable processes running on open ports and it displays files that processes have opened. Unknown processes accessing a port should be flagged as suspicious and analyzed.
Command: lsof -n
7. The Linux command ps can be used to view running processes. Suspicious processes flagged earlier can be viewed in more detail. It should be noted that if another process is found having started around the same time as the suspicious process, it should also be flagged. The two processes might have been started by the same attack or service.
Command: ps -aux
8. It is also important to check the user currently logged into a machine remotely and locally. The users command can be used to see logged in users.
Command: users
Warning: A non-authorized user may be logged in or hijacking an account remotely (Jones, Bejtlich and Rose).
9. The internal routing table should be examined to ensure a hacker or process has not manipulated the traffic from a device. Netstat can be used to view the routing table. Unfamiliar routes or connections should be flagged as suspicious and used to formulate a hypothesis.
Command: Netstat –rn
10. The lsmod command can be used to view all loaded kernels.
Command: lsmod
Warning: There is a chance that a kernel could have been trojaned, if this is the case it can be discovered from viewing all loaded kernel modules (Jones, Bejtlich and Rose).
11. Scheduled Jobs on a Linux machine can be viewed with crontab. An attacker with the right privileges can schedule malicious jobs to run at designated times. A simple for loop command can be used to see the jobs each user has scheduled.
Command: for user in $(cut -f1 -d: /etc/passwd); do crontab -u $user -l; done
Warning: A hacker can run a job at odd times, such as 2:00 AM, which would likely go unannounced to most users (Jones, Bejtlich and Rose).
12. Mount or df can be used to see all mounted file systems.
Command: df
Warning: Hackers can mount a file system as a way to transfer data to the victim machine.
13. The top command can be used to show all services running. Foreign services should be marked as suspicious and researched.
Command: top
Further service startup scripts can be seen in the /etc/init.d directory.
Command: ls /etc/init.d
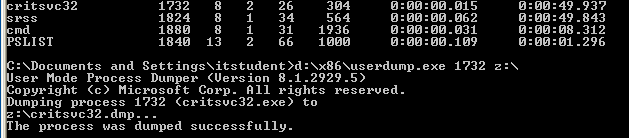
14. Process dumps are important in reviewing the actions of a process. A live dump file of process activity can be found in the proc. Following, the string command can be used to pull out any words or sentences found in the dump file. This material can be reviewed to gain an understanding of what actions a process or executable performs.
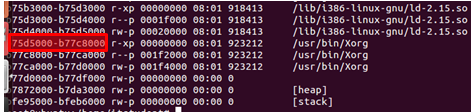
Command to find process and memory block: cat /proc/<PID>/maps
The picture below highlights where addresses for a piece of memory can be found in /proc/<PID>/maps
Command: gdb –-pid=<PID>
dump memory <NETWORK DRIVE LOCATION TO WRITE MEMORY> <ADDRESS RANGE>
Ex: dump memory /mnt/test 0x75d5000 0xb77c8000
Command: strings <NAME OF DUMP FILE>
15. After the volatile information is analyzed, non-volatile information can be examined. This includes all logs, incriminating files stored on the system, internet history, stored emails or any other physical file on disk. Manual investigation can be used to review this material.
16. When performing a live response investigation, it is import to be paranoid and research anything that is not obviously a familiar service, process, file or activity.
Jones, Keith J., Richard Bejtlich, and Curtis W. Rose. Real Digital Forensics. Upper Saddle River (N. J.): Addison-Wesley, 2006. Print.