Best Practices: Live Capture and Analysis of Network Based Evidence
Network captures and traffic analyses can provide further information and understanding on the activity of a compromised machine. This guide is specific to Linux based tools.
1. Recommended tools for capturing network-based evidence files include:
- Netcat (http://nmap.org/ncat) – Create TCP channels between devices that can be used to pass information.
- Native Linux commands and tools (Explained in further detail throughout the guide)
- Tcpdump
- Hd (hexdump)
- Tcpdstat (http://staff.washington.edu/dittrich/talks/core02/tools/tools.html) – Breaks down traffic patterns and provides an average of transfer rates for any given communication libpcap formatted file.
- Snort (http://www.snort.org/) – An open source intrusion prevention and detection system.
- Tcptrace(http://www.tcptrace.org/) – Provides data on connections such as elapsed time, bytes and segments sent/received, retransmission, round trip times, window advertisements and throughput.
- Tcpflow (https://github.com/simsong/tcpflow)– A tool that captures and stores communications in a convenient way for protocol analysis and debugging.
2. There are four types of information that can be retrieved with network-based evidence (Jones, Bejtlich and Rose).
- Full content data – Full content data includes the entire network communications recorded for analysis. It consists of every bit present in the actual packets including headers and application information.
- Session data – Data that includes the time, parties involved and duration of the communication.
- Alert data – Data that has been predefined as interesting.
- Statistical data – Reporting data
3. Since data cannot be written to disk, it is best to map a network drive or use Netcat to transfer information between analyzing machine and the victim machine.
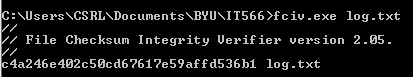
Warning: All files created or tools used need to include a checksum for validation against fraud. A checksum is basically the value of a file hash. If one character in the code or file is changed, the hash will produce a different checksum. This helps validate content. A specific application version will have a unique checksum different from all other versions of the software. A good tool to use to create checksums is File Checksum Integrity Verifier (http://support.microsoft.com/kb/841290).
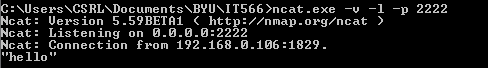
4. If using Netcat to transfer logs the following commands can be used:
Command to setup a Netcat listener on host machine: nc –v –l –p <PORT> > <LOG FILE (FOR TCPDUMP FILE USE EXTENSION .lpc>
The port number is any port desired for the Netcat listener to listen on for communication. The log file is just a file for the data to be stored in.
Command to send data from a victim machine: <COMMAND> | nc <IP ADDRESS OF LISTENING MACHINE> <PORT>
Basically the command sends the results of a command performed on the victim machine. <COMMAND> is the command issued on the victim machine. The IP address and port are of the host machine with NetCat listening.
5. Begin by capturing traffic.
Command: tcpdump –n –i <NETWORK INTERFACE> –s <BYTES TAKEN FROM PACKET>
Pipe the file over Netcat or send to a file on a network drive with additional parameters: -w <FILE PATH>.lpc
Warning: The file will show evidence of any unknown communications. It will not provide detail on any results or items actual obtained in the communications (Jones, Bejtlich and Rose).
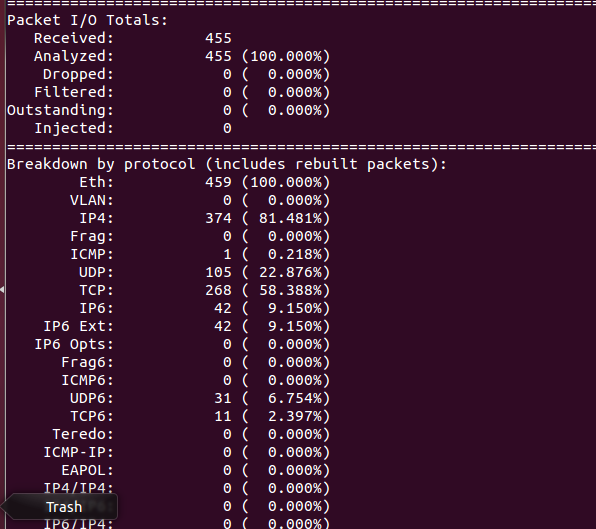
6. The tool tcpdstat can be used from the analyzing machine on the file to gain statistical data on the general flow of traffic found in the tcpdump. Statics help describe the traffic patterns and communication protocols used over a period of time.
Command: tcpdstat <TCP DUMP FILE> > <RESULTS FILE>
Warning: Telnet and FTP are communication protocols that transfer data in clear text. However, smarter intruders will use different protocols to encrypt their communications.
7. Snort can be used to find alert data (Jones, Bejtlich and Rose).
Command: snort –c <LOCATION OF SNORT.CONF OR ANOTHER RULESET> -r <TCPDUMP FILE> -b –l <RESULT FILE PATH>
Warning: Snort will only raise flags and alerts depending on the rule set provided. Be familiar with the rules used in order to know what type of traffic may pass unnoticed by snort.
8. The tool tcptrace is used to gain session information.
Command: tcptrace –n –r <TCPDUMP FILE> > <RESULT FILE PATH>
Warning: Session data can provide evidence to suspicious communications of abnormal lengths. Numerous attempted sessions over a short period of time could show signs of a brute force attack on a network (Jones, Bejtlich and Rose).
9. Tcpflow organizes and prints out full content data on a TCP stream from a given log.
Command: tcpflow –r <TCPDUMP FILE> port <SOURCE PORT NUMBER> and <DESTINATION PORT NUMBER>
The results will be stored in a file formatted with the following name structure:
[timestampT]sourceip.sourceport-destip.destport[–VLAN][cNNNN]
To read the results a hex editor is required. Linux environments include a local tool to perform the read.
Command: hd <TCPFLOW FILENAME> > <RESULT FILE PATH>
Warning: This is a great tool that can visually show commands and inputs an intruder used in a particular stream; however, an investigator has to be aware of suspicious ports in order to retrieve quality pieces of evidence. The other tools used in this best practices help identify those communications (Jones, Bejtlich and Rose).
10. When analyzing network-based pieces of evidence, it is import to be paranoid and research anything that is not obviously a familiar service, process, file or activity. The evidence found can help administrators understand weaknesses in the system in order to strengthen security and improve case standings in a court.
Jones, Keith J., Richard Bejtlich, and Curtis W. Rose. Real Digital Forensics. Upper Saddle River (N. J.): Addison-Wesley, 2006. Print.