Skip to content

Just another technical day

Somethingk: Tech Blog

  • Home
  • About

Scientific Computing

Python Visualization

By K4Paul November 18, 2013 November 18, 2013 0 Python HPC, Python, Scientific Computing, Visualization, XKCD

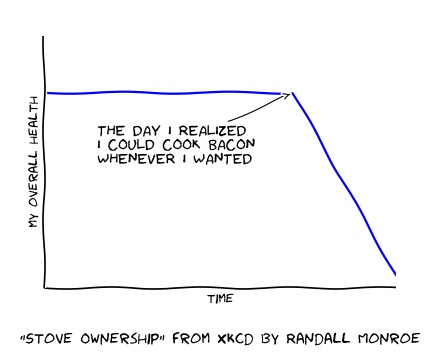
Here is another great reason to love Python!

Matplotlib is a plotting visualization tool for plotting graphs in python. What better way to present data than in XKCD format!

Python XKCD Plotting

image

Connect with me on Linkedin

Categories

Recent Comments

  • Jk on Reordering an Array Based on Another Array’s Order in Javascript
  • LDLC_KolDzeRa on Simple AVL Tree in C++
  • vepambattu chand on Reordering an Array Based on Another Array’s Order in Javascript
  • Unknown on OpenVAS Quick and Easy: Scheduling and Running Tasks
  • K4Paul on Javascript Mousemove Scroll Event
Boka WordPress Theme By ThemeTim